I had a management exam yesterday. The teacher which taught the course decided to use the two statements multiple choice style of questioning (for the entire exam). It basically works like this:
Statement 1
Statement 2
A. Statement 1 is true, statement 2 is false
B. Statement 2 is true, statement 1 is false
C. Both statements are true
D. Both statements are false
Using common sense, it should be very clear, that this kind of questioning doesn't give a good representation of a student's knowledge. I investigated the issue further and wrote a
simple exam simulator to create empirical data:
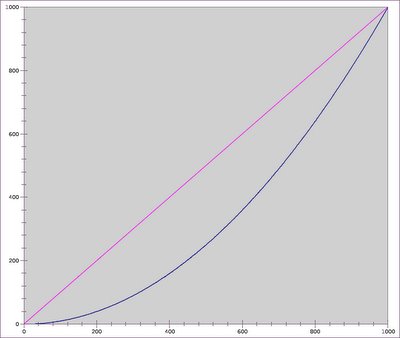
The X-axis represents the actual knowledge level of a hypothetical student, so a 700 promille on the X-axis of the graph means the student factually knows the answer to 700 promille of all statements and has to guess the remaining statements. The Y-axis represents the actual grade that would have been assigned to the student in question. Taking a look at the above graph the purple graph represents an ideal world without guessing, the blue graph represents the two statement multiple choice examination style, and it shows a delta of up to 250 promille below ideal grading. So this style of questioning is hardly fair at all.


